Overview
This is the legendary Titanic ML competition – the best, first challenge for you to dive into ML competitions.
The competition is simple: use machine learning to create a model that predicts which passengers survived the Titanic shipwreck.
The sinking of the Titanic is one of the most infamous shipwrecks in history.
On April 15, 1912, during her maiden voyage, the widely considered “unsinkable” RMS Titanic sank after colliding with an iceberg. Unfortunately, there weren’t enough lifeboats for everyone onboard, resulting in the death of 1502 out of 2224 passengers and crew.
While there was some element of luck involved in surviving, it seems some groups of people were more likely to survive than others.
In this challenge, we will build a predictive model that answers the question: “what sorts of people were more likely to survive?” using passenger data (ie name, age, gender, socio-economic class, etc).
Data Description
In this competition, you’ll gain access to two similar datasets that include passenger information like name, age, gender, socio-economic class, etc. One dataset is titled train.csv and the other is titled test.csv.
Train.csv will contain the details of a subset of the passengers on board (891 to be exact) and importantly, will reveal whether they survived or not, also known as the “ground truth”.
The test.csv dataset contains similar information but does not disclose the “ground truth” for each passenger. It’s your job to predict these outcomes.
Using the patterns you find in the train.csv data, predict whether the other 418 passengers on board (found in test.csv) survived.
You can find the dataset here.
Files
The data has been split into two groups:
- training set (train.csv)
- test set (test.csv)
So lets begin here…
import numpy as np
import pandas as pd
import matplotlib.pyplot as plt
import seaborn as sns

from sklearn.model_selection import train_test_split
from sklearn.linear_model import LogisticRegression
from sklearn.metrics import classification_report
from sklearn.metrics import confusion_matrix
from sklearn.metrics import accuracy_score
Load Data
train = pd.read_csv('../input/titanic/train.csv')
test = pd.read_csv('../input/titanic/test.csv')
print('Number of passengers in train dataset: ' + str(len(train)))
Number of passengers in train dataset: 891
Data Analysis
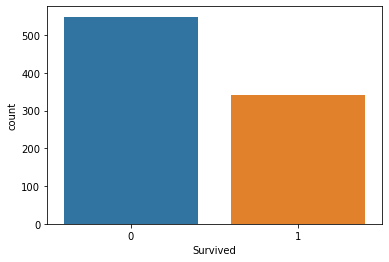
Number of passengers Survived
sns.countplot(x = 'Survived', data = train)
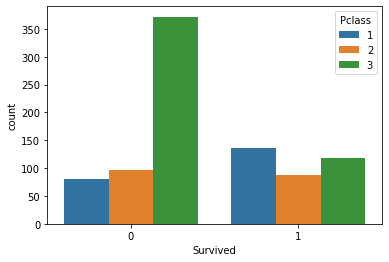
Number of passengers Survived based on Passenger Class
sns.countplot(x = 'Survived', hue = 'Pclass', data = train)
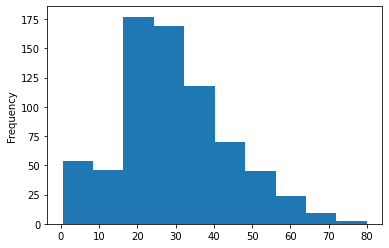
Frequency of passengers group by Age
train['Age'].plot.hist()
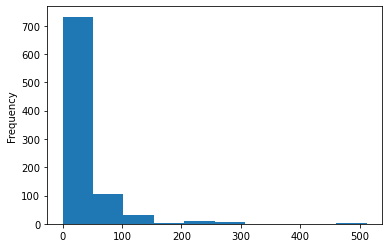
Frequency of passengers group by Fare
train['Fare'].plot.hist()
Train Dataset Information
train.info()
RangeIndex: 891 entries, 0 to 890
Data columns (total 12 columns):
 #   Column       Non-Null Count  Dtype
---  ------       --------------  -----
 0   PassengerId  891 non-null    int64
 1   Survived     891 non-null    int64
 2   Pclass       891 non-null    int64
 3   Name         891 non-null    object
 4   Sex          891 non-null    object
 5   Age          714 non-null    float64
 6   SibSp        891 non-null    int64
 7   Parch        891 non-null    int64
 8   Ticket       891 non-null    object
 9   Fare         891 non-null    float64
 10  Cabin        204 non-null    object
 11  Embarked     889 non-null    object
dtypes: float64(2), int64(5), object(5)
memory usage: 83.7+ KB
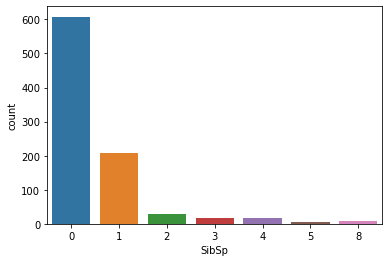
Number of siblings / spouses aboard the Titanic
sns.countplot(x = 'SibSp', data = train)
Check for NULL values in training set
train.isnull().sum()
PassengerId      0
Survived         0
Pclass           0
Name             0
Sex              0
Age            177
SibSp            0
Parch            0
Ticket           0
Fare             0
Cabin          687
Embarked         2
dtype: int64
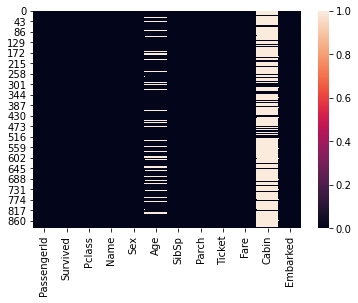
Heatmap for NULL values
sns.heatmap(train.isnull())
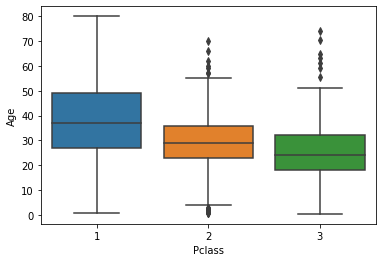
Passenger Class vs Age
sns.boxplot(x = 'Pclass', y = 'Age', data = train)
Data Preprocessing
Train Data
sex = pd.get_dummies(train['Sex'], drop_first = True)
embark = pd.get_dummies(train['Embarked'],drop_first=True)
pcl = pd.get_dummies(train['Pclass'],drop_first=True)
Concat new features in train data
train = pd.concat([train,sex,embark,pcl],axis=1)
train.head()
| PassengerId | Survived | Pclass | Name | Sex | Age | SibSp | Parch | Ticket | Fare | Cabin | Embarked | male | Q | S | 2 | 3 | |
|---|---|---|---|---|---|---|---|---|---|---|---|---|---|---|---|---|---|
| 0 | 1 | 0 | 3 | Braund, Mr. Owen Harris | male | 22.0 | 1 | 0 | A/5 21171 | 7.2500 | NaN | S | 1 | 0 | 1 | 0 | 1 |
| 1 | 2 | 1 | 1 | Cumings, Mrs. John Bradley (Florence Briggs Th... | female | 38.0 | 1 | 0 | PC 17599 | 71.2833 | C85 | C | 0 | 0 | 0 | 0 | 0 |
| 2 | 3 | 1 | 3 | Heikkinen, Miss. Laina | female | 26.0 | 0 | 0 | STON/O2. 3101282 | 7.9250 | NaN | S | 0 | 0 | 1 | 0 | 1 |
| 3 | 4 | 1 | 1 | Futrelle, Mrs. Jacques Heath (Lily May Peel) | female | 35.0 | 1 | 0 | 113803 | 53.1000 | C123 | S | 0 | 0 | 1 | 0 | 0 |
| 4 | 5 | 0 | 3 | Allen, Mr. William Henry | male | 35.0 | 0 | 0 | 373450 | 8.0500 | NaN | S | 1 | 0 | 1 | 0 | 1 |
Dropping columns from train dataset
train.drop(['Pclass','Sex','Embarked','Cabin','PassengerId','Name','Ticket'],axis=1, inplace=True)
train.head()
| Survived | Age | SibSp | Parch | Fare | male | Q | S | 2 | 3 | |
|---|---|---|---|---|---|---|---|---|---|---|
| 0 | 0 | 22.0 | 1 | 0 | 7.2500 | 1 | 0 | 1 | 0 | 1 |
| 1 | 1 | 38.0 | 1 | 0 | 71.2833 | 0 | 0 | 0 | 0 | 0 |
| 2 | 1 | 26.0 | 0 | 0 | 7.9250 | 0 | 0 | 1 | 0 | 1 |
| 3 | 1 | 35.0 | 1 | 0 | 53.1000 | 0 | 0 | 1 | 0 | 0 |
| 4 | 0 | 35.0 | 0 | 0 | 8.0500 | 1 | 0 | 1 | 0 | 1 |
Check for NULL values
train.isnull().sum()
Survived      0
Age         177
SibSp         0
Parch         0
Fare          0
male          0
Q             0
S             0
2             0
3             0
dtype: int64
Handling NULL values
train_values = {'Age': round(np.mean(train['Age']))}
train = train.fillna(value = train_values)
train.head()
| Survived | Age | SibSp | Parch | Fare | male | Q | S | 2 | 3 | |
|---|---|---|---|---|---|---|---|---|---|---|
| 0 | 0 | 22.0 | 1 | 0 | 7.2500 | 1 | 0 | 1 | 0 | 1 |
| 1 | 1 | 38.0 | 1 | 0 | 71.2833 | 0 | 0 | 0 | 0 | 0 |
| 2 | 1 | 26.0 | 0 | 0 | 7.9250 | 0 | 0 | 1 | 0 | 1 |
| 3 | 1 | 35.0 | 1 | 0 | 53.1000 | 0 | 0 | 1 | 0 | 0 |
| 4 | 0 | 35.0 | 0 | 0 | 8.0500 | 1 | 0 | 1 | 0 | 1 |
Test Data
sex = pd.get_dummies(test['Sex'], drop_first = True)
embark = pd.get_dummies(test['Embarked'],drop_first=True)
pcl = pd.get_dummies(test['Pclass'],drop_first=True)
Concat new features in test data
test = pd.concat([test,sex,embark,pcl],axis=1)
test.head()
| PassengerId | Pclass | Name | Sex | Age | SibSp | Parch | Ticket | Fare | Cabin | Embarked | male | Q | S | 2 | 3 | |
|---|---|---|---|---|---|---|---|---|---|---|---|---|---|---|---|---|
| 0 | 892 | 3 | Kelly, Mr. James | male | 34.5 | 0 | 0 | 330911 | 7.8292 | NaN | Q | 1 | 1 | 0 | 0 | 1 |
| 1 | 893 | 3 | Wilkes, Mrs. James (Ellen Needs) | female | 47.0 | 1 | 0 | 363272 | 7.0000 | NaN | S | 0 | 0 | 1 | 0 | 1 |
| 2 | 894 | 2 | Myles, Mr. Thomas Francis | male | 62.0 | 0 | 0 | 240276 | 9.6875 | NaN | Q | 1 | 1 | 0 | 1 | 0 |
| 3 | 895 | 3 | Wirz, Mr. Albert | male | 27.0 | 0 | 0 | 315154 | 8.6625 | NaN | S | 1 | 0 | 1 | 0 | 1 |
| 4 | 896 | 3 | Hirvonen, Mrs. Alexander (Helga E Lindqvist) | female | 22.0 | 1 | 1 | 3101298 | 12.2875 | NaN | S | 0 | 0 | 1 | 0 | 1 |
Dropping columns from train dataset
test.drop(['Pclass','Sex','Embarked','Cabin','PassengerId','Name','Ticket'],axis=1, inplace=True)
Check for NULL values
test.isnull().sum()
Age      86
SibSp     0
Parch     0
Fare      1
male      0
Q         0
S         0
2         0
3         0
dtype: int64
Handling NULL values
test_values = {'Age':round(np.mean(test['Age'])), 'Fare':round(np.mean(test['Fare']))}
test = test.fillna(value = test_values)
test.head()
| Age | SibSp | Parch | Fare | male | Q | S | 2 | 3 | |
|---|---|---|---|---|---|---|---|---|---|
| 0 | 34.5 | 0 | 0 | 7.8292 | 1 | 1 | 0 | 0 | 1 |
| 1 | 47.0 | 1 | 0 | 7.0000 | 0 | 0 | 1 | 0 | 1 |
| 2 | 62.0 | 0 | 0 | 9.6875 | 1 | 1 | 0 | 1 | 0 |
| 3 | 27.0 | 0 | 0 | 8.6625 | 1 | 0 | 1 | 0 | 1 |
| 4 | 22.0 | 1 | 1 | 12.2875 | 0 | 0 | 1 | 0 | 1 |
X = train.drop('Survived',axis=1)
y = train['Survived']
X_train, X_test, y_train, y_test = train_test_split(X, y, test_size=0.3, random_state=1)
Define Model
logmodel = LogisticRegression(solver = 'liblinear')
Fit Model
logmodel.fit(X_train, y_train)
LogisticRegression(C=1.0, class_weight=None, dual=False, fit_intercept=True,
                   intercept_scaling=1, l1_ratio=None, max_iter=100,
                   multi_class='auto', n_jobs=None, penalty='l2',
                   random_state=None, solver='liblinear', tol=0.0001, verbose=0,
                   warm_start=False)
predections = logmodel.predict(X_test)
Model Evaluation
Classification Report
print(classification_report(y_test, predections))
              precision    recall  f1-score   support

           0       0.77      0.88      0.82       153
           1       0.81      0.65      0.72       115

    accuracy                           0.78       268
   macro avg       0.79      0.77      0.77       268
weighted avg       0.79      0.78      0.78       268
Confusion Matrix
print(confusion_matrix(y_test, predections))
[[135  18]
 [ 40  75]]
Accuracy
print(accuracy_score(y_test, predections))
0.7835820895522388
Prediction
test_predictions = logmodel.predict(test)
Submission
sub_file = pd.read_csv('../input/titanic/gender_submission.csv')
sub_file['Survived'] = test_predictions
sub_file.to_csv('submission.csv',index=False)